

☀️ Take Full Control of Your Solar Energy System
Welcome to the Solar Energy Dashboard – a comprehensive, fully-functional solar monitoring and management solution proudly developed by BizTooly. Whether you’re a homeowner tracking daily savings or a solar installer managing client systems, this dashboard provides everything you need to monitor, analyze, and optimize solar power generation in real-time.
Built with modern web technologies (React, TypeScript, and Tailwind CSS), this professional-grade tool simulates real-world solar data, offers manual input options for accuracy, and calculates financial ROI – all in one sleek, responsive interface.
🚀 Why Choose This Solar Dashboard?
✅ No Hardware Required – Works entirely in your browser with simulated or manual data
✅ Real-Time Power Monitoring – Live gauge with auto and manual modes
✅ Financial ROI Calculator – Track savings, payback period, and 25-year projections
✅ Weather Impact Analysis – See how temperature, humidity, and UV affect efficiency
✅ Multi-User Support – Secure login system with demo access
✅ Fully Customizable – Update system capacity, panel count, inverter type, and electricity rates
✅ Data Persistence – All data saved locally per user
✅ Mobile Responsive – Works perfectly on desktop, tablet, and phone
✅ White-Label Ready – Includes BizTooly branding (customizable for resellers)
🔧 How to Use the Solar Energy Dashboard
1. Getting Started
-
Demo Access: Click “Try Demo Account” for instant access with pre-loaded sample data
-
Create Account: Sign up with your email and password
-
Login: Existing users can sign in securely
2. Configure Your System
Navigate to Settings and enter:
-
System capacity (kW)
-
Number of solar panels
-
Battery capacity (kWh)
-
Inverter type
-
Local electricity rate ($/kWh)
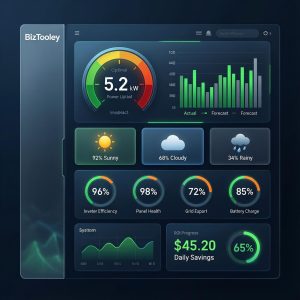
3. Monitor Real-Time Power
The Power Gauge shows current generation:
-
Auto Mode: Simulates realistic output based on time of day
-
Manual Mode: Enter actual readings from your inverter
4. Track Daily Generation
Use the Daily Generation Tracker to:
-
Log hourly actual vs forecast data
-
View performance percentage
-
Generate sample data for testing
-
Compare multiple days
5. Calculate Weather Impact
The Weather Impact Tool adjusts efficiency based on:
-
Sky condition (Clear, Cloudy, Rainy)
-
Temperature
-
Humidity
-
Wind speed
-
UV index
6. Analyze System Health
The Efficiency Metrics panel tracks:
-
System efficiency
-
Inverter efficiency
-
Battery status
-
Performance ratio
-
Overall health grade (A+ to D)
7. Calculate Savings & ROI
Enter your daily generation, electricity rate, system cost, and months operating to get:
-
Daily/weekly/monthly/yearly savings
-
Current ROI percentage
-
Payback period (years/months)
-
25-year lifetime savings
-
Environmental impact (CO₂ offset, trees planted)
📊 Who Is This For?
-
Homeowners with solar panels
-
Solar Installers managing client systems
-
Energy Consultants providing performance reports
-
Educators teaching renewable energy concepts
-
Developers looking for a solar monitoring template
-
Businesses tracking sustainability goals
🧰 Technical Specifications
| Feature | Details |
|---|---|
| Technology Stack | React 19, TypeScript, Vite, Tailwind CSS |
| Charts | Recharts for data visualization |
| Icons | Lucide React |
| Authentication | Email/password with demo mode |
| Data Storage | Browser localStorage (per user) |
| Responsive | Yes – mobile, tablet, desktop |
| Browser Support | Chrome, Firefox, Safari, Edge |
| Deployment | Static hosting (Netlify, Vercel, GitHub Pages) |
🌟 Key Features at a Glance
| Feature | Description |
|---|---|
| Power Gauge | Real-time kW output with auto/manual modes |
| Daily Generation | 24-hour actual vs forecast tracking |
| Weather Impact | 5-parameter efficiency calculator |
| Efficiency Metrics | 4 key system health indicators |
| ROI Calculator | Savings, payback, 25-year projections |
| Environmental Impact | CO₂ offset & tree equivalent |
| Settings | Fully customizable system parameters |
| User Accounts | Multi-user support with secure login |
| Help System | In-app guides and tooltips |
📸 Screenshots
-
Login Page – Clean, professional authentication screen with BizTooly branding
-
Dashboard Overview – All five tools displayed in a responsive grid
-
Power Gauge – Visual meter showing current generation
-
Daily Generation Chart – Hourly bar chart with actual vs forecast
-
Weather Impact Calculator – Interactive form with real-time efficiency calculation
-
Efficiency Metrics – Progress bars and health grade
-
Savings Calculator – Financial cards, ROI progress, and monthly trend chart
-
Settings Page – System configuration interface
🎁 What’s Included
-
Complete source code (React + TypeScript)
-
Pre-built components and pages
-
Sample data and demo account
-
Comprehensive USER_GUIDE.md
-
Installation instructions
-
BizTooly branding (can be customized)
📦 System Requirements
-
Node.js v18 or higher
-
npm or yarn package manager
-
Modern web browser
🚀 Quick Installation
# Download the package
unzip solar-energy-dashboard.zip
cd solar-energy-dashboard

# Install dependencies
npm install

# Run development server
npm run dev

# Build for production
npm run build
💼 About BizTooly
BizTooly is a professional software development company specializing in business management tools, energy monitoring solutions, and productivity applications. Our products are designed with user experience, accuracy, and reliability in mind.
🔒 License & Support
-
License: Standard WordPress Plugin License
-
Support: Email support included for 6 months
-
Updates: Free updates for 1 year
-
Documentation: Complete user guide included
⭐ Why Customers Love It
“Finally a solar dashboard that actually works! The ROI calculator helped me understand exactly when my system will pay for itself.” – Michael R.
“I use this to monitor my clients’ solar installations. The weather impact tool is incredibly accurate.” – Sarah T., Solar Installer
“Beautiful design and so easy to use. The demo mode sold me instantly.” – David L.


Reviews
There are no reviews yet.